Nanopublication — Computational Image Analysis - AQC0930
Claim 1: Computational Image Analysis - AQC0930
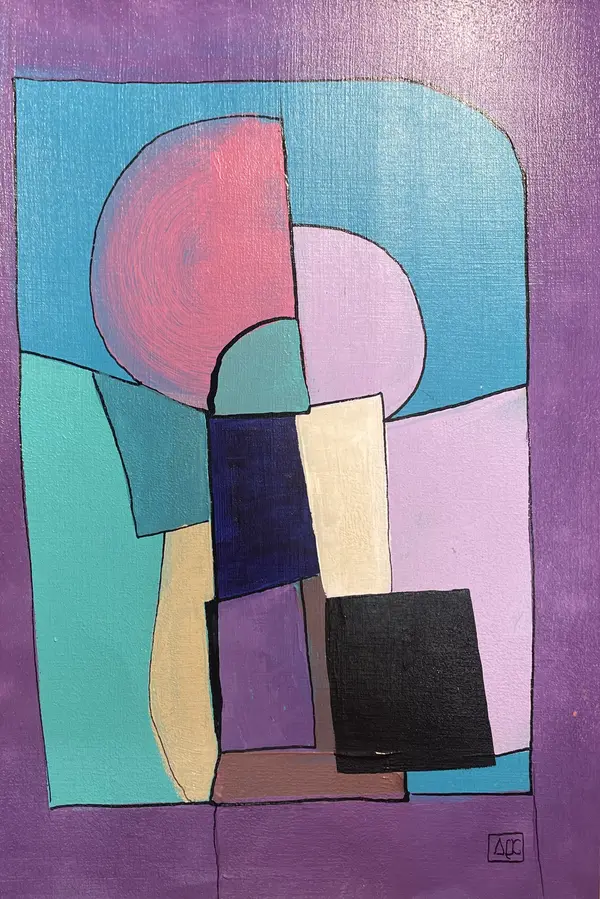
Computational image analysis [3] of artwork Bb Minor [1] - Research on Harmony - Variations 11 (AQC0930) [2] by Arnaud Quercy [2] using k-means clustering method with 10 color extraction parameters. Analysis includes color distribution, texture metrics, brightness/contrast measurements, and spatial pattern characterization. Analysis completed on 2026-03-04.
Context
Analysis performed according to MMIDS-CMP-2025 [3] includes four metric categories: (1) Color distribution via k-means (10 colors), (2) Texture analysis using Haralick features, (3) Brightness and contrast measurements, (4) Spatial pattern characterization. Source image [5]: 1944x2915 pixels. Analysis date: 2026-03-04.
Color Analysis
| Rank | Color | Hex | % | Family | Name |
|---|---|---|---|---|---|
| 1 | 704A72 | 19.7 | red-violet | dusty mauve | |
| 2 | 61AFBB | 15.8 | blue-green | cadetblue | |
| 3 | 916B99 | 14.1 | red-violet | dusty mauve | |
| 4 | DBBAD3 | 10.8 | red-violet | thistle | |
| 5 | 25212F | 10.2 | violet | very dark gray | |
| 6 | C4839D | 8.8 | red | rosybrown | |
| 7 | 4C96A5 | 7.3 | blue-green | steelblue | |
| 8 | EFDCD8 | 5.6 | red-orange | antiquewhite | |
| 9 | 95C9DA | 5.0 | blue | skyblue | |
| 10 | CDB588 | 2.7 | yellow-orange | tan | |
| 11 | 02071A | 0.3 | blue-violet | very dark gray [Accent] | |
| 12 | 675138 | 0.3 | orange | dark brown [Accent] | |
| 13 | 86A08D | 0.3 | yellow-green | darkseagreen [Accent] |
Color Families:
| Family | % |
|---|---|
| red-violet | 44.6 |
| blue-green | 23.1 |
| violet | 10.2 |
| red | 8.8 |
| red-orange | 5.6 |
| blue | 5.0 |
| yellow-orange | 2.7 |
| blue-violet | 0.3 |
| orange | 0.3 |
| yellow-green | 0.3 |
Accent Colors:
| Hex | Family | Name | Chroma |
|---|---|---|---|
| 02071A | blue-violet | very dark gray | 11.2 |
| 675138 | orange | dark brown | 19.0 |
| 86A08D | yellow-green | darkseagreen | 14.8 |
Texture Analysis
| Metric | Value |
|---|---|
| Global Roughness | 0.206 |
| Mean Local Roughness | 0.039 |
| Roughness Uniformity | 0.035 |
| Edge Density | 0.182 |
| Mean Gradient Magnitude | 0.281 |
| Gradient Variance | 0.108 |
| Gradient Smoothness | 0.0 |
| Directional Coherence | 0.016 |
| Pattern Complexity | 0.121 |
| Pattern Repetition | 1.0 |
| Detail Frequency Ratio | 0.673 |
| Spatial Variation | 0.121 |
| Texture Consistency | 0.65 |
Brightness & Contrast Analysis
| Metric | Value |
|---|---|
| Mean Brightness | 0.529 |
| Brightness Variance | 0.206 |
| Brightness Uniformity | 0.611 |
| Brightness Skewness | -0.215 |
| Brightness Entropy | 7.611 |
| Rms Contrast | 0.206 |
| Michelson Contrast | 1.0 |
| Weber Contrast | 0.683 |
| Mean Local Contrast | 0.04 |
| Contrast Uniformity | 0.124 |
| Dynamic Range | 1.0 |
| Effective Dynamic Range | 0.718 |
| Shadow Percentage | 15.604 |
| Midtone Percentage | 59.245 |
| Highlight Percentage | 25.151 |
| Shadow Clipping | 0.0 |
| Highlight Clipping | 0.0 |
| Tonal Balance | 0.291 |
| Fine Contrast | 0.023 |
| Medium Contrast | 0.048 |
| Coarse Contrast | 0.06 |
| Multiscale Contrast Ratio | 0.385 |
| Edge Contrast | 0.281 |
| Contrast Clustering | 0.35 |
Spatial Distribution Analysis
| Metric | Value |
|---|---|
| Spatial Coherence | 0.725 |
| Color Clustering | 0.754 |
| Color Transition Smoothness | 0.289 |
| Transition Uniformity | 0.319 |
| Sharp Transition Ratio | 0.1 |
| Transition Directionality | 0.015 |
| Mean Saturation | 0.342 |
| Saturation Variance | 0.022 |
| Low Saturation Ratio | 0.346 |
| Medium Saturation Ratio | 0.65 |
| High Saturation Ratio | 0.005 |
| Saturation Clustering | 0.999 |
| Hue Concentration | 0.481 |
| Complementary Balance | 0.031 |
| Analogous Dominance | 0.487 |
| Temperature Bias | -0.134 |
Methodology
This analysis employs standardized computational methods for objective image characterization. Color extraction uses k-means clustering algorithm. Texture analysis applies Haralick feature extraction. Brightness metrics include mean, variance, and distribution analysis. Spatial patterns are characterized through coherence and clustering measurements. All methods are deterministic and reproducible. Analysis performed by Multimodal Institute's computational imaging systems.
References
[1] Arnaud Quercy (2025). Bb Minor - Research on Harmony - Variations 11 — Catalog raisonné. https://arnaudquercy.art/en/catalogue-raisonne/AQC0930.html
https://arnaudquercy.art/fr/catalogue-raisonne/AQC0930.html
[2] Quercy, A. (2025). Untitled - Gallery. https://artquamanima.com/en/artworks/2025/11/bb-minor-research-on-harmony-variations-11_ikt.html
[3] Quercy, A. (2025). Computational Image Analysis Standard - MMIDS-CMP-2025 https://multimodal.institute/en/publications/2025/10/mmids-cmp-2025-computational-image-analysis-standard-dg1.html
Epistemic profile
| Claim type | computational analysis |
|---|---|
| Voice | third person |
| Epistemic status | empirical measurement |
| Methodology | computational analysis |
| Certainty | high |
Checksum (SHA-256)
97034aea5c78632583e442913cd91c5ccd94988bd13cdaa1f7bf0523497ef66e